
Scores of small business owners aren’t on top of their business numbers. If you are looking to grow your business, it’s important to know your numbers and have the information readily accessible.
With a clear picture of your business’s financial health, you can develop a vision for the future. Knowing your numbers allows you to manage your business more successfully, freeing up time and money for things like improved branding, developing new products, and hiring additional staff.
Do you know your business’s profit revenue, break-even point, and profit margin? Do you have a clear understanding of your business model? What changes and additions could you make so your business model is in harmony with your personal goals and your vision for your business?
Once you have facts at your fingertips — and a clear understanding of your business’s financial statements — you can address problem areas and consider changes to boost your bottom line.
For starters, if your business financials are in electronic form, become acquainted with the software. Ask your accountant if you need help. Learn to produce reports that will help guide your business decisions. Arm yourself with the ability to access the information you need to make wise choices for your business.
Cash versus Accrual Accounting
You may have heard the terms “cash basis accounting” and “accrual basis accounting.” Your net income number changes depending on the method. If you aren’t sure which method you’re using, ask your accountant.
In a nutshell, the difference between the two is simply the timing of when the entries are booked. Timing — that’s all it is!
Let’s use the character Wimpy from the Popeye the Sailor Man cartoon to illustrate the two methods. Wimpy was famous for saying, “I’ll gladly pay you Tuesday for a hamburger today.” Here’s how that transaction would look for each of the accounting methods.
Cash basis: The sale of the hamburger and the receipt of cash would be recorded on Tuesday. Companies on a cash basis only record the transaction when the cash is received.
Accrual basis: Wimpy’s hamburger purchase would be recorded on the day he ate the burger. The receipt would not be recorded until Tuesday when Wimpy — hopefully — makes good on his promise to pay.
In real life, it might be more than a few days between the time you perform work for a client and when payment is received, affecting the amount of taxes you’d pay to various agencies. Manipulating these dates (legally, of course) is one of many tax-planning strategies.
To run your business in a forward-thinking way, the accrual method is preferred. You can record invoices even if payment hasn’t been received and enter bills before payment is due. You can budget for cash flow needs with a clear picture of your revenue and income.
If you struggle to keep up with your bookkeeping and just want to catch up once a year, a cash basis is adequate. However, you’re sacrificing a lot of good information that could have helped your business run better all year long. For some businesses, a hybrid of both methods may be the most cost-effective.
Chart of Accounts
The list of accounts within your accounting software is called the “Chart of Accounts.” It should meet three needs: Make it faster to do your taxes, give insight into what you’ve made and spent, and allow you to spend more time on revenue analysis and less on expense analysis.
Accounts should be grouped the same as the lines on your tax return. Get a copy of the tax form you fill out. For example, a sole proprietor uses a Schedule C which is part of the 1040 tax return and a corporation completes an 1120 tax return. There are a few areas, such as meals and entertainment that are only partially deductible. Your tax preparer can help you with that.
Consider how you want to see your revenue: By product line, major supplier, category of the solution to the customer, customer type, service type, location, by the job, or by distribution method.
Once that’s determined, accounts can be created and the items you sell can be connected to the proper account. When you enter an invoice and select the item, it will be booked to the account you’ve created and you can see your revenue in the way you want.
Similarly, you can categorize costs of goods sold or direct costs. These are often the costs of acquiring the products you sell, labor generating the sales you make, and other direct costs. Many businesses set up a corresponding cost of goods sold account for each revenue account.
Expense accounts are the ones most in number. Most charts of accounts could use improvement in helping the small business track marketing and customer acquisition costs, which are very important in many small businesses. Talk to your accountant if you need help in this area.
Income Statement
In your accounting system, under reports, there will be a report called “Income Statement.” It might also be called the Profit and Loss Statement (P&L). This report helps you understand your company’s earnings over a particular period of time.
The income statement can be for a month, year, previous year, or any other date range. You can choose the period of time it covers when you create the report. This is different than a Balance Sheet — another key financial report — that only shows balances for a single date in time.
Income statements include two to five components. Most small businesses have three: Sales or Revenue, Cost of Sales/Cost of Goods Sold, and Expenses.
Sales or revenue include the total of everything you’ve sold or created an invoice for and collected. Cost of sales/cost of goods sold includes the direct costs of purchasing inventory or the direct costs of selling services. Expenses are the sum of what you’ve spent for your business that will be used up within a year including advertising, rent, office supplies, legal services, travel, and more. It doesn’t include unsold inventory or loan payments.
The two other components that may appear on your income statement include Other Income (Income not from normal business operations, like interest income) and Other Expenses (Interest expense is the most common).
Here is an income statement for an incorporated consultant who takes a paycheck and has a little bit of admin help:
| Income Statement | |
| ABC Company | |
| For the year ended 31 December 2015 | |
| YTD | |
| Revenue | |
| Consulting | $100,000.00 |
| Workshops | $20,000.00 |
| Total Revenue | $120,000.00 |
| Less Cost of Sales | |
| Cost of Goods Sold | $10,000.00 |
| Total Cost of Sales | $10,000.00 |
| Gross Profit | $110,000.00 |
| Expenses | |
| Accounting | $2,750.00 |
| Dues & Subscriptions | $1,800.00 |
| Education | $1,200.00 |
| Health Insurance – Employer Paid | $3,000.00 |
| Income Tax Expense | $800.00 |
| Insurance | $2,000.00 |
| Marketing | $1,200.00 |
| Meals | $120.00 |
| Office Expenses | $3,000.00 |
| Payroll Tax Expense | $6,000.00 |
| Postage & Delivery | $300.00 |
| Printing & Stationery | $250.00 |
| Telephone & Internet | $2,400.00 |
| Travel | $700.00 |
| Wages and Salaries | $12,000.00 |
| Wages Officers | $52,000.00 |
| Total Expenses | $89,520.00 |
| Net Income / (Loss) before Tax | $20,480.00 |
In the Revenue section, there are two types of revenue: Consulting and workshops. In the cost of goods sold section, workshop expenses are included since they are directly related to generating the workshop income.
Notice on this income statement that revenue and cost of goods sold are netted into a subtotal called gross profit. This subtotal is more relevant for retailers, manufacturers and businesses selling inventory.
The expenses section often contains a long list of expense accounts such as office supplies, rent, insurance, telephone, and many others.
The final number, Net Income, is computed as follows: Revenue – Cost of Goods Sold – Expenses = Net Income. Net income is the same as your company’s profits. It’s effectively the difference between what you’ve made less what you’ve spent.
In the case of this consultant, they paid themselves a salary of $52,000, plus they’ve earned a profit of $20,480 for the year in their business. If your business is not incorporated, you should have a larger profit and no salary showing.
Now, here is a sample income statement with no salary:
| Income Statement | |||
| XYZ Sole Proprietor | |||
| For the year ended 31 December 2015 | |||
| YTD | |||
| Revenue | |||
| Services | $90,000.00 | ||
| Total Revenue | $90,000.00 | ||
| Expenses | |||
| Accounting | $2,500.00 | ||
| Dues & Subscriptions | $1,800.00 | ||
| Education | $2,400.00 | ||
| Insurance | $2,000.00 | ||
| Marketing | $3,000.00 | ||
| Meals | $350.00 | ||
| Office Expenses | $5,000.00 | ||
| Postage & Delivery | $600.00 | ||
| Printing & Stationery | $550.00 | ||
| Telephone & Internet | $3,600.00 | ||
| Travel | $1,200.00 | ||
| Total Expenses | $23,000.00 | ||
| Net Income / (Loss) | $67,000.00 | ||
The Net Income of $67,000 is effectively your salary.
The profit on your income statement is not the same as your cash. This may be due to timing differences between payments you make and how they impact your profit. Here are some examples of how that can happen:
Loans – If you receive proceeds from a loan, your cash will have a higher balance than your profit. As you pay it off, the difference will decrease.
Inventory – If you have unsold goods, the value of those goods is reflected as an asset. In this case, your cash will be lower than your profits.
Assets – Items lasting more than one year may be classified as an asset. Until the assets are used up, your cash will be lower than your profits.
Draws – If you take money out of your business that is not a salary, it does not impact the income statement but it does impact cash.
The income statement is a great start to seeing your profitability as a whole business. But the way to make your business more profitable is to play with the numbers – slice and dice them – and get into the details of your earning and spending.
Balance Sheet
The balance sheet, also called a statement of financial position, represents the financial picture for your business for a particular date in time. Balances change from day to day. A balance sheet does not represent a range of dates over a period of time. It is the only representative of your business’s financial picture for that date — literally, a snapshot.
A balance sheet has three parts: Assets, Liabilities, and Owner’s Equity.
Assets – In the simplest of terms, assets are what you OWN. A Cash Balance is often listed first on a balance sheet. The cash balance is generally the amount in your bank account minus any outstanding checks.
Assets include Accounts Receivable. That is the total owed by clients who have been billed or invoiced but have not paid. Inventory is another category in assets. The cost of all unsold inventory is listed in the inventory account.
Fixed Assets include furnishings, equipment, and business automobiles or other objects that you will likely possess for years or an extended period of time. The value of your fixed assets depreciates as those items age.
Liabilities – Liabilities are what you OWE. Whether it’s money owed to vendors, employees or taxes, the amounts will be displayed in the liabilities area of your company’s balance sheet.
Accounts Payable — also known as your unpaid bills — are a liability. Bank loan accounts are also liabilities. Every bank loan (principal due only, not the interest) will be listed separately under accounts payable.
Equity – The third piece of the balance sheet is Owner’s Equity. How this portion looks will differ based on the type of business entity. For corporations, a common stock account will be shown. The amount represents your original investment into the business and will be the same figure reported on your company’s Articles of Incorporation. It is very rare that this dollar amount changes during the lifetime of your business.
Often there is a Paid-in Capital account listed. This is representative of the additional funds you’ve infused into the company or you may see a shareholder’s distribution account which records the amount withdrawn beyond the common stock balance.
For corporations, a Retained Earnings account will also be listed, reflecting total profit and/or loss for all years you have been in business.
If your business is a partnership, an account will be listed under the Equity section for each and every business partner. The amount listed is the net amount each has invested into the business, adding or subtracting business income or loss.
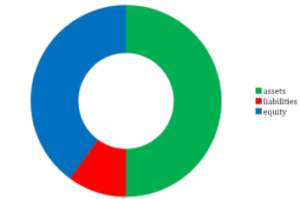
A balance sheet formula looks like this: Assets = Liabilities + Equity. A great way to graphically represent a balance sheet is to use a doughnut graph (shown below). For this example, let’s use the following numbers: 100,000 assets, 20,000 liabilities and 80,000 equity.
The assets are green, and more green is good. The liabilities are red, and less red is good. Blue is the equity.
This is a broad overview of a business balance sheet. If you have questions about the specifics of your Balance Sheet, don’t hesitate to ask your accountant.
Understanding Assets vs. Expenses
Assets and expenses both have a “debit” balance naturally on the financial statements, but that’s where their similarities end. Spending on one can make you rich and spending too much on the other can leave you broke.
An asset is a tangible resource that belongs to you or your business and that still has value after a year or longer. The best assets grow in value over time, but some lose their value too. Real estate typically goes up in value, while a car loses value, or depreciates heavily, in its first few years.
An expense is a money you may need to spend, but after a year, there is nothing lasting to show for it. The best example of an asset versus an expense is mortgage versus rent. Generally, spending on an asset builds or better preserves your wealth. Spending on an expense drains your worth because you don’t own anything at the end.
The path to building your wealth is to spend on assets when having a choice and minimize expenses when you can. Here are some typical expenses and how you can reduce them:
Utilities and Telephone – Monitor or automate thermostats. Renegotiate phone services every six months.
Rent – Look for executive office space, buy the smallest square feet you can, or work at home.
Dues and Subscriptions – Review what you’re really using/attending.
Advertising and Marketing – Track the effectiveness so you’ll know what works best.
Bank and Credit Card Fees – Pay credit card debt first, transfer balances, negotiate with the bank to waive charges, cancel anything you’re not using, and shop around for better merchant rates.
Office Supplies, Printing, and Postage – Choose “Forever” stamps, print on demand rather than in bulk, go paperless.
Health Insurance – Choose high deductibles, go without, or offer employees cash to purchase their own.
Travel, Meals, and Entertainment – Ensure there is an ROI for these expenditures, join frequent flyer programs, use hotels.com and other discounters. Remember that meals and entertainment are only 50% deductible and subject to reasonableness.
Ratios
A balance sheet can help you measure your company’s overall “health” in a couple of ways, and one way is to categorize the balances into the short term and the long term.
A short-term balance is one that can be collected or needs to be paid within one year or less. Long-term denotes beyond one year. You can have short and long-term assets and short and long-term liabilities.
The measure of health comes in when you can compare your short-term assets to your short-term liabilities. The evaluation here is whether your company is “liquid” or can be converted into cash quickly. It’s fairly simple. Having more short-term assets than short-term liabilities is good.
Short-term assets, also called current assets, include cash, accounts receivable, inventory, and any other assets expected to be sold or consumed in 12 months or less.
Short-term liabilities, also called current liabilities, including credit card debt, accounts payable, the portion of a loan that needs to be paid within one year, and any other liabilities that will be paid in 12 months or less.
The current ratio measures liquidity and you can compute it for your company with this formula:
Short-term assets / short-term liabilities = Current ratio.
A ratio over 1 is desirable because it means you can cover your short-term liabilities with your short-term assets. Each industry is different, however, so you will want to find the current ratio for your industry.
Bankers will look at your current ratio and determine its health before granting you a loan. You may also be required to maintain a certain current ratio in order to keep your loan from being called. This ratio will vary by industry.